Understanding Orthomosaics, Point Clouds, and 3D Models from Drone Data
When you fly a drone over a site and capture hundreds of overlapping photos, the real value lies in what you can build from those images afterward. Raw photos are useful for quick visual checks, but to measure distances, calculate volumes, or inspect terrain in detail, you need processed data products. Three of the most common outputs are orthomosaics, point clouds, and 3D models. Each serves a different purpose, and understanding the differences helps you choose the right tool for the job.
What Is an Orthomosaic?
An orthomosaic is a stitched-together, geometrically corrected aerial image. Unlike a simple photo collage, where perspective distortion and lens curvature cause objects to lean or shift, an orthomosaic has been "orthorectified." That means every pixel has been adjusted so that it appears as if you were looking straight down from directly above each point. The result is a single, seamless image with a uniform scale, much like a map.
Orthomosaic processing aligns and blends hundreds or thousands of individual drone photos using ground control points and GPS data embedded in each image. The software identifies common features in overlapping photos, matches them, and then calculates the correct position for each pixel. Once complete, the orthomosaic gives you a true-to-life, measurable representation of the ground below.
For practical use, orthomosaics are excellent for site overviews, progress documentation, and visual inspections. You can open one in a standard viewer and see every detail of a construction site, farm field, or inspection area in context. Because the image is georeferenced, you can also overlay it with CAD drawings or previous surveys to track changes over time. The trade-off is that orthomosaics are essentially 2D: they show surface texture and colour, but they don't capture height or volume directly.
Point Clouds: The Raw 3D Data
A point cloud is a collection of thousands or millions of individual 3D points, each defined by X, Y, and Z coordinates. The points come from photogrammetry (processing overlapping photos) or from LiDAR sensors that measure distance with laser pulses. Each point represents a specific location on a surface, and together they form a dense, accurate representation of the scene's shape.
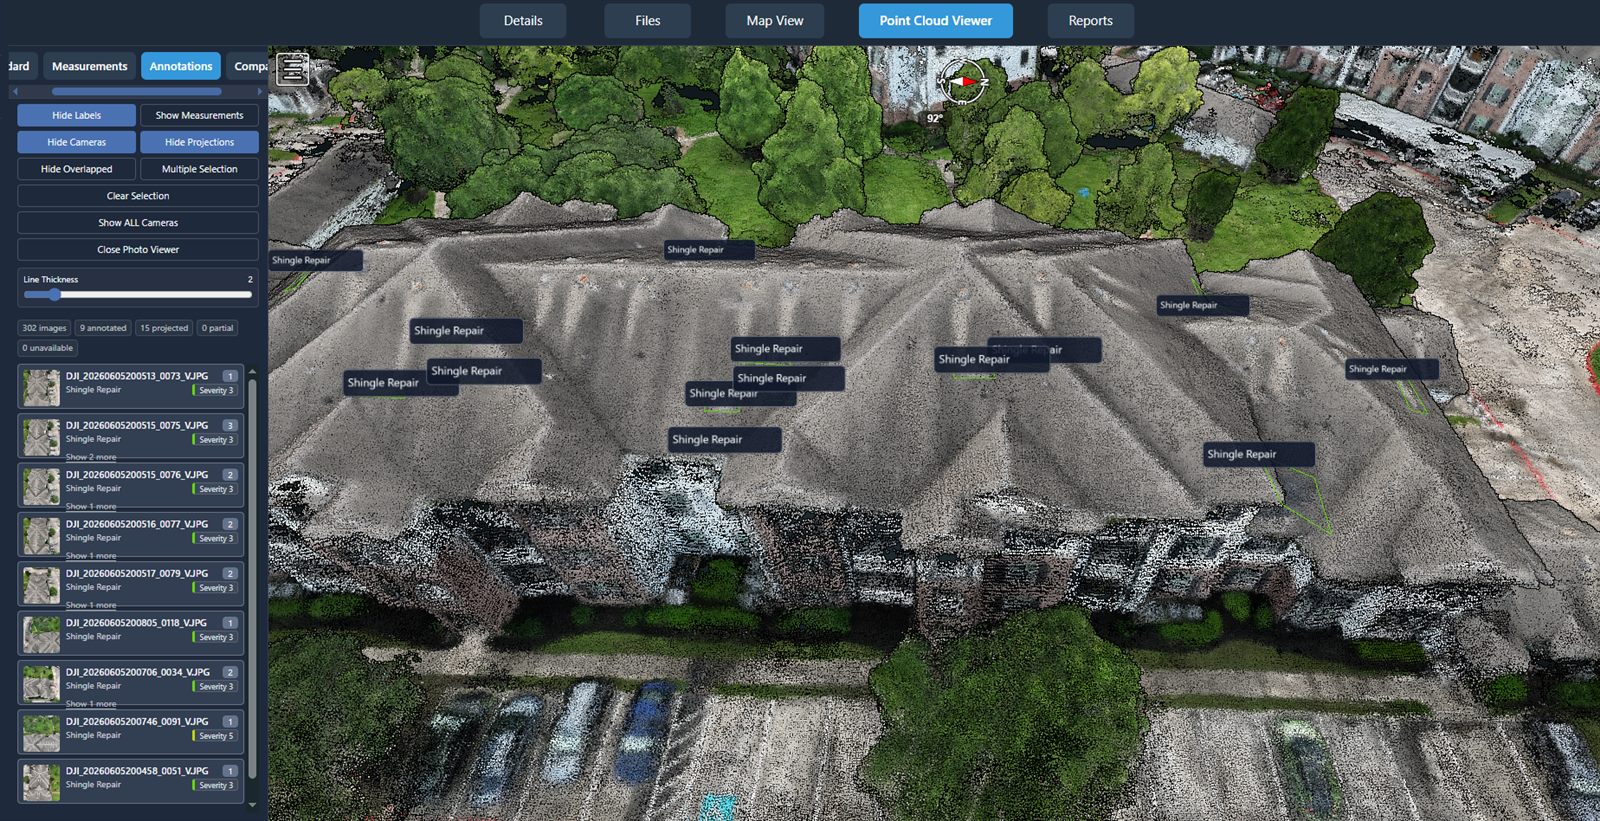
Point clouds are the intermediate step between raw images and finished 3D models. They contain no surface texture or colour unless you add RGB values from the source photos. What they do contain is precise geometry: every edge, slope, and undulation of the terrain, structures, or objects captured. You can rotate, zoom, and measure distances directly in the point cloud, and you can export it to other software for analysis.
One major advantage of point clouds is their flexibility. You can filter out noise, classify points by elevation, or extract cross-sections. For tasks like calculating stockpile volumes, checking cut-and-fill quantities, or modelling a building facade, point clouds are the go-to format. The downside is that they are not immediately intuitive to view: a raw point cloud looks like a scatter of dots until you apply colour, shading, or mesh surfaces to make sense of it.
3D Models: From Points to Surfaces
A 3D model takes the geometry from a point cloud and turns it into a continuous surface, often with texture and colour applied. There are two common types: digital surface models (DSM) and digital terrain models (DTM). A DSM includes everything on the ground - vegetation, buildings, equipment - while a DTM strips away those features to show the bare earth. Both are generated by connecting adjacent points into triangles (a mesh) and then draping the orthomosaic over the top for realism.
3D models are what most people picture when they think of drone mapping. They look like a video game environment: realistic, rotatable, and immersive. You can walk through a 3D model virtually, inspect a structure from any angle, or simulate drainage and line-of-sight. They are powerful for presentations, client reports, and public communication because they communicate shape and context so clearly.
But 3D models have limits. File sizes can be large, and rendering them smoothly requires capable hardware. More importantly, the accuracy of a 3D model depends on the quality of the point cloud and the processing parameters. If the point cloud is noisy or sparse, the model may have holes or unrealistic bumps. For precision work, many professionals still prefer to measure directly on the point cloud rather than on the derived model.
How They Work Together
In a typical drone data workflow, you start with overlapping images. The processing software creates a sparse point cloud to align the photos, then refines it into a dense point cloud. From that dense point cloud, the software generates an orthomosaic by projecting each pixel onto the correct ground coordinate. At the same time, it builds a 3D mesh from the point cloud to produce a DSM or DTM. The final deliverables - orthomosaic, point cloud, and 3D model - are all derived from the same source data, and each serves a different analytical purpose.
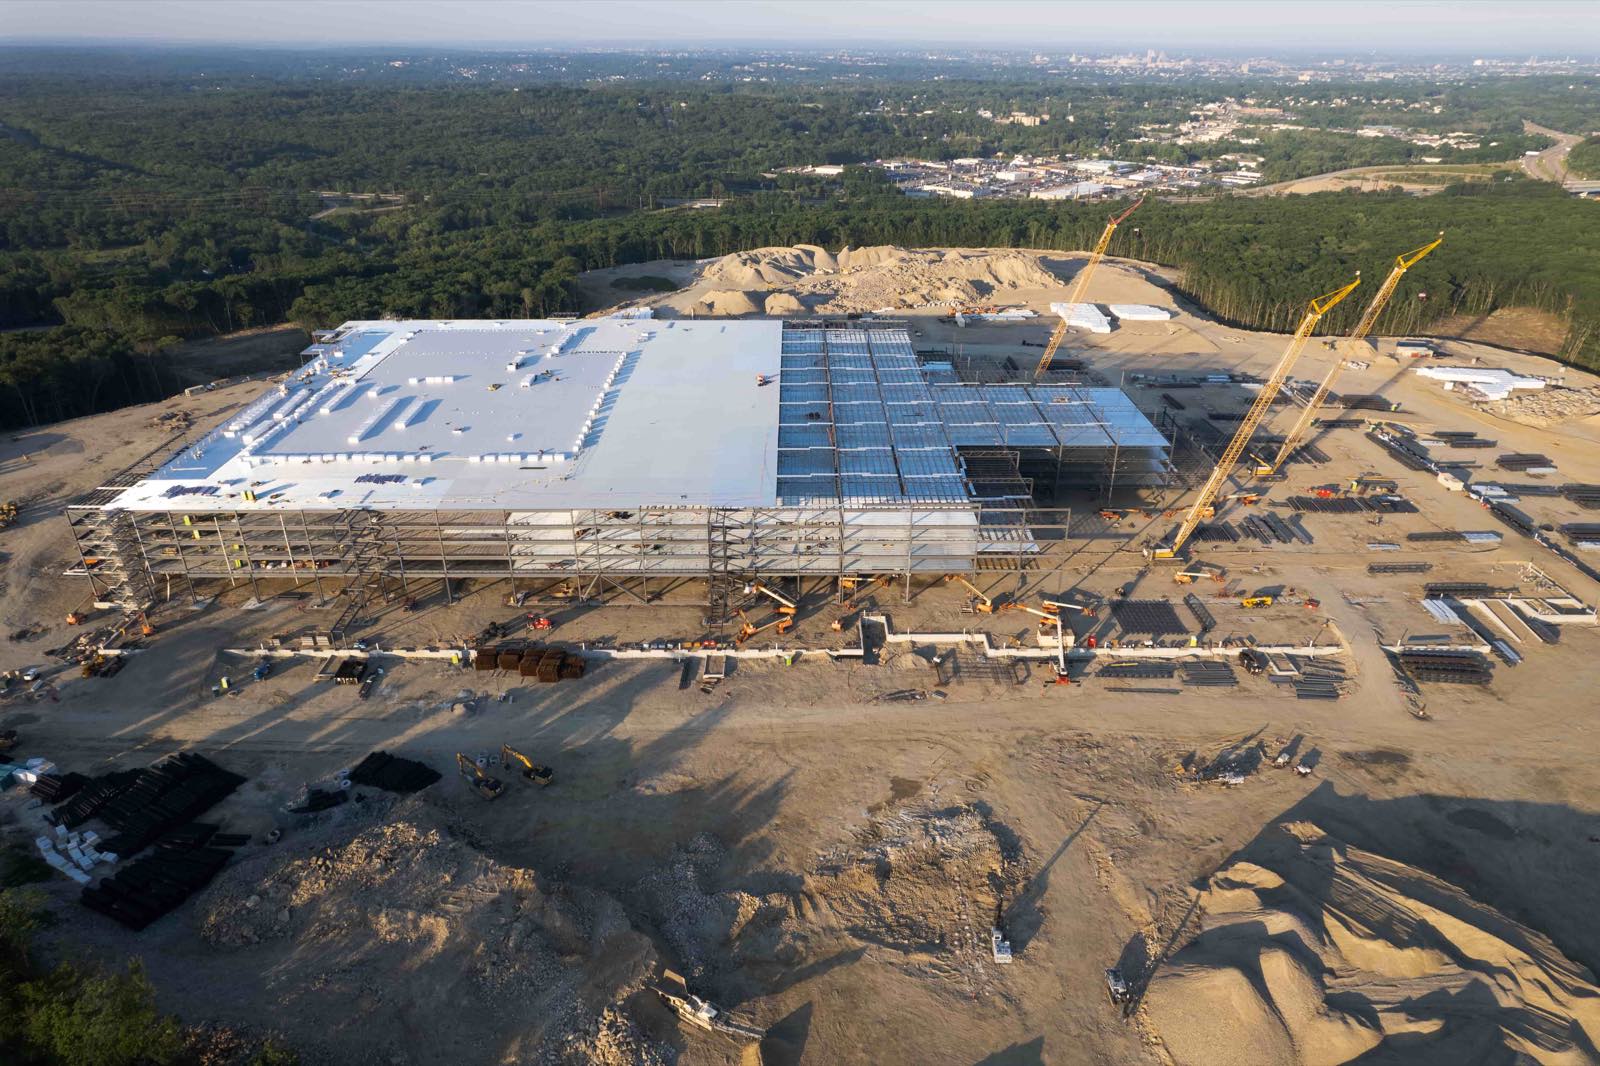
For example, a civil engineer might use the orthomosaic to mark proposed road alignments, use the point cloud to calculate earthwork volumes, and use the 3D model to show stakeholders what the finished project will look like. Having all three formats available means you can switch between a 2D map, a raw geometric dataset, and a visualised surface depending on the task at hand.
Choosing the Right Output for Your Project
Not every job needs all three. For a simple roof inspection, an orthomosaic with high resolution may be enough to spot cracks or debris. For a volumetric survey of a gravel pile, a point cloud gives you the most accurate volume calculation. For a heritage building documentation project, a textured 3D model provides the best archival record. The key is to match the output to the question you are trying to answer.
Factors that influence the choice include the required accuracy, the time available for processing, the software you have, and how the data will be used downstream. Orthomosaics are relatively quick to produce, point clouds take more processing time, and textured 3D models are the most resource-intensive. If you need measurements within a few centimetres, invest the extra time in a dense point cloud. If you need a quick visual reference, an orthomosaic may suffice.
Processing Considerations
Orthomosaic processing is where the quality of the final products is determined. The number of images, their overlap, the camera settings, and the presence of clear ground control points all affect the result. A common mistake is flying too fast or too high, resulting in blurry images or insufficient overlap. For reliable outputs, aim for at least 75% front overlap and 60% side overlap, and keep shutter speeds fast enough to avoid motion blur.
Another consideration is the terrain itself. Flat, open areas with good texture (like grass or gravel) process easily. Dense forests, reflective water, and uniform surfaces like snow or sand can confuse the matching algorithms, leading to gaps or distortions. In those cases, adding artificial targets or increasing overlap helps the software find matches.
If you are working with a service provider, it helps to know what formats you will receive and what you can do with them. Many platforms now offer integrated processing that delivers all three outputs from a single upload. For example, National Drone Services orthomosaic processing handles the alignment, rectification, and model generation in one workflow, so you get an orthomosaic, point cloud, and 3D model without juggling multiple tools. The convenience of a single pipeline saves time and reduces the risk of errors from manual data transfer between programs.
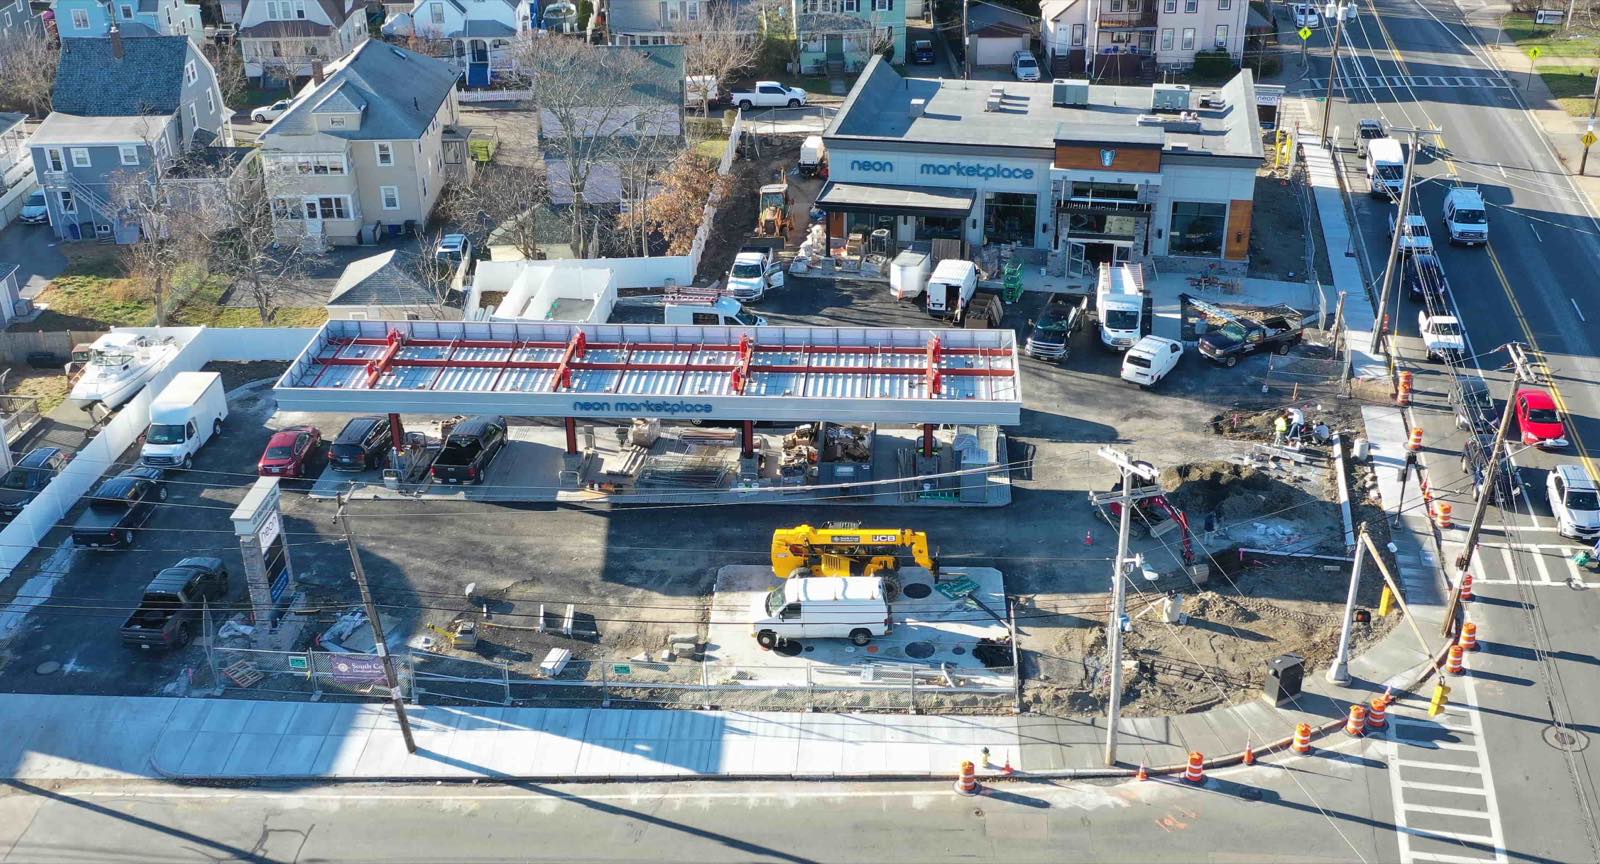
When you receive the deliverables, check the orthomosaic for visible seams, colour shifts, or misalignments. For point clouds, inspect the density and look for holes. A good point cloud should have a fairly uniform point spacing across the area of interest. For 3D models, verify that the mesh follows the actual surface and that no artifacts (like spikes or flat triangles) appear where the terrain changes abruptly.
Putting It All Together
Understanding the difference between orthomosaics, point clouds, and 3D models helps you communicate your needs clearly and get the most value from drone data. Each format has strengths and weaknesses, and the best approach often involves using two or three of them in combination. As the technology matures, processing tools continue to improve, making it easier to produce all three from a single flight. National Drone Services orthomosaic processing is one example of a platform that brings these capabilities together, but the principles apply regardless of the software you choose.
Whether you are surveying a construction site, monitoring crop health, or mapping an archaeological dig, the outputs you choose shape what you can learn. With a solid grasp of what each format offers, you can make informed decisions and get the most out of your drone data investment.
National Drone Services on social media
 Facebook
Ends · AERIALPROGRESS